Udemy – Learn Amazon Prometheus in 1 day
English | Tutorial | Size: 727.09 MB
Start to learn Amazon Managed Services for Prometheus (AMP) through real hands-on alone with practical AWS skills.

Udemy – Learn Amazon Prometheus in 1 day
English | Tutorial | Size: 727.09 MB


Prometheus Entertainment – Empire of Dreams: The Story of the Star Wars Trilogy (2015)
English | Documentary | Size: 3.05 GB

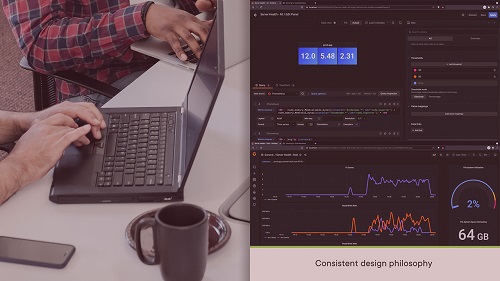
PluralSight – Building Dashboards From Prometheus Data In Grafana Bookware-KNiSO
English | Size: 163.14 MB
Category: Tutorial
![[Update Links] PluralSight - Instrumenting Applications with Metrics for Prometheus](https://i114.fastpic.ru/big/2020/1014/88/6b04999dbc544a47a8fc4be2559bdf88.png)
PluralSight – Instrumenting Applications with Metrics for Prometheus Bookware-KNiSO
English | Size: 305.20 MB
Category: Tutorial