Packt – Real Time Data Stream Processing in Azure

Packt – Real Time Data Stream Processing in Azure-RiDWARE
English | Size: 1.11 GB
Category: Tutorial


Delve into big data streaming with Azure using Event Hubs, Data Lake, and Azure Stream Analytics
More Information
Learn
Gain a thorough understanding of Azure Stream Analytics
Discover how to ingest data using Azure Event Hubs
Find out how to archive data from Event Hubs to Azure Data Lake
Provision Event Hubs, Data Lake, and SQL Server in Azure
Listen to an event hub and stream the data to a SQL Server table
Communicate with event hubs for effortless data transfer
Discover how event hub groups work

PluralSight – Visualizing Data With Pivotcharts

PluralSight – Visualizing Data With Pivotcharts-NOLEDGE
English | Size: 379.86 MB
Category: Tutorial


This course explores Excel PivotCharts that display a visual representation of PivotTables. The course shows you how to choose a PivotChart, select the data to visualize and modify the look and feel of the chart to meet your requirements. A picture is worth a thousand words, and PivotCharts are no exception, providing a neat way of visualizing the data from a corresponding PivotTable. In this course, Visualizing Data with PivotCharts, you will gain the skills to quickly produce charts to a professional standard, which neatly summarize the associated PivotTable allowing you to visualize the data and spot any trends within it. First, you ill learn what PivotCharts are and the different types of charts available for you to use. Next, you will discover how to create PivotCharts, choose the correct chart type, and finesse the look and feel of the chart. Finally, you will explore how to make the chart truly interactive by adding filters slicers, and drill-up/drill-down capability, helping you answer all those difficult data-related questions that your coworkers and managers just keep on asking! When you are finished this course, you will have the skills and knowledge to use Excel PivotCharts in order to professionally present your data

Skillshare – Data Science and Python Machine Learning-ViGOROUS

Skillshare – Data Science and Python Machine Learning-ViGOROUS
English | Size: 451.73 MB
Category: Tutorial


Data Scientists enjoy one of the top-paying jobs, with an average salary of $120,000 according to Glassdoor and Indeed. That’s just the average! And it’s not just about money – it’s interesting work too!

Skillshare – Fetch API Data with React-ViGOROUS

Skillshare – Fetch API Data with React-ViGOROUS
English | Size: 527.61 MB
Category: Tutorial


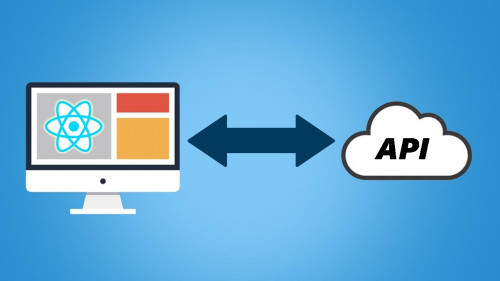
In this course you are going to learn how to fetch Api data using React
We are going to use the free Chuck Norris API, where you will be able to search for different keywords, and get back some jokes related to the category you just searched.